

UM-Flint Social Media Report: January 1 – March 31, 2013
The purpose of the following report is to identify trends in community behavior across the University of Michigan-Flint’s social networks. The content shared on Facebook and Twitter was categorized into topic types, which are fairly consistent between the two. The only exceptions include: Response and User Content on Twitter (not used on Facebook).
Social Network Summary
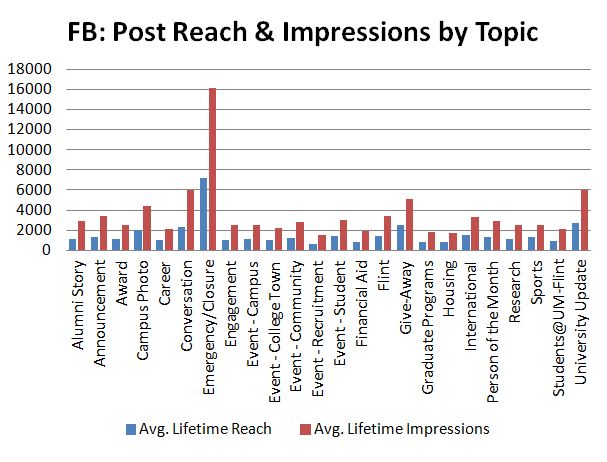
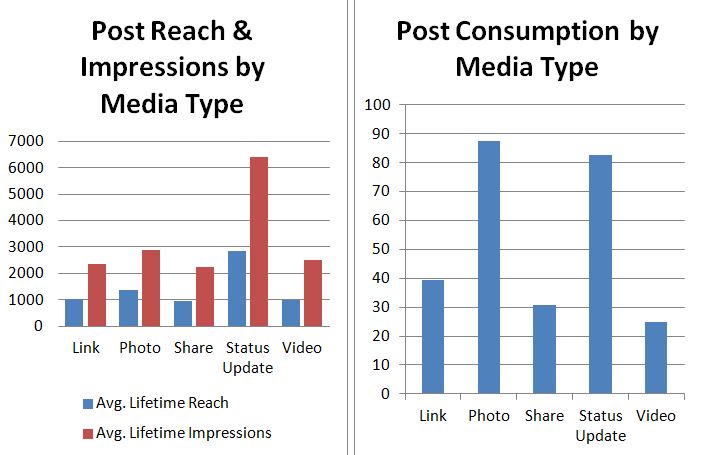
The University of Michigan-Flint Facebook Page had a total of 9,436 likes as of March 31, 2013, an increase of 558 (6.3%) in the three-month period. During this time, posts categorized as Emergency/Closure achieved the greatest reach and impressions, as well as the most consumption (clicks within a post). Aside from campus closure updates, which are rare, University Updates (i.e. new logo announcement, virtual tour launch, etc.) consistently achieved high reach, impressions, and consumption. In terms of media type, text-only status updates achieved the greatest reach and impressions, and were also high in post consumption.
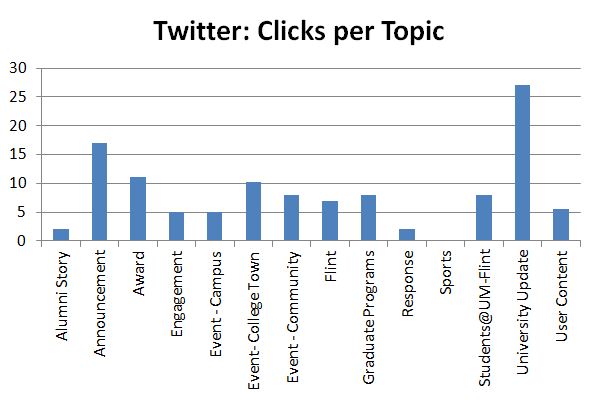
UM-Flint’s Twitter account was followed by 2,336 people users on March 31, an increase of 273 (13.2%) for the quarter. @UMFlint was mentioned by users 7.2 times per day, and the account averaged 2.2 tweets per day. The #umflint hashtag was used 1,460 times (927 tweets; 533 retweets). Keywords related to UM-Flint were used 4,162 times (2,841 tweets; 1,321 retweets). When measuring consumption based on links clicked, links categorized as University Update were most often clicked. This behavior is consistent with Facebook data.
UM-Flint’s Instagram account, which is managed by the Students@UM-Flint team, posted 209 before the end of March. The account has 150 followers. The account was activated in August 2012.
YouTube
Videos on UM-Flint’s YouTube channel were viewed 3,852 times. The majority of these views, or 49.8% were viewed on YouTube’s watch page, followed by 27.9% on embedded players (i.e. umflint.edu), and 18.1% mobile devices. The most-watched video, which is embedded many places on the UM-Flint website, was “Why UM-Flint” with 612 views.
Students@UM-Flint
Between January 1 and March 31, the Students@UM-Flint blog had 1,140 unique pageviews. Direct traffic and organic search accounted for the top traffic sources, followed by the UM-Flint website and social media links.
UM-Flint Social
In this quarter, social.umflint.edu had 343 unique visitors and 2,870 pageviews. Visitors viewed the Facebook tab most often, followed by Twitter and then Instagram. The Blogs tab, which aims to give campus blogs some visibility, had 397 pageviews.
Social Media Activity By Content Type